


Research
At GreenSight, our research focuses on understanding algal growth and physiology through intelligent sensing and data analysis. By combining optical measurements with advanced signal processing and machine learning, we investigate how environmental conditions shape biomass development over time. This approach allows us to move from raw sensor signals to meaningful biological insights, revealing growth dynamics, rhythmic patterns, and stress responses in algal cultures
Sensor-based tubular photobioreactor with adjustable LED lighting

A tubular photobioreactor has been put into operation at the Institute of Physics. It is designed for the experimental investigation of growth and metabolic processes in microalgae cultures and their targeted optimization. The system combines closed culture management with spectrally controllable LED lighting and comprehensive sensor technology for in-situ process monitoring.
The system allows continuous recording of physicochemical and optical parameters, including:
- Optical density, scattering, and spectral absorption (biomass development, pigment content)
- Biomass
- Nitrate and phosphate content
- Fluorescence signals for quantifying photosynthetic efficiency and chlorophyll content
- Temperature and pH value
- CO₂ concentration and oxygen saturation in the medium
The LED lighting can be modulated and controlled in terms of both spectral composition and intensity. This allows light qualities, light gradients, and photoperiodic cycles to be reproduced as they are relevant for the study of circadian rhythms and light-dependent metabolic processes. Automated lighting control also allows for targeted stimulation and adaptation protocols.
All measurement data is collected via a networked sensor system, provided in an open data format, and evaluated in an AI-supported analysis environment. This enables the correlation of culture parameters with physiological state variables, including the modelling of growth rates, pigment dynamics, and metabolic shifts.

Multispectral "mosaic" sensor chip for optical in situ analysis

For the continuous monitoring of microalgae cultures, a multispectral sensor system was developed in collaboration with Sensoik Technologies GmbH that records spectrally and temporally resolved absorption, scattered light, and fluorescence signals directly in the photobioreactor. The mosaic sensor chip combines several optical measurement principles in a compact, robust design that is optimized for long-term operation in liquid culture systems.
The sensor features:
- 6 integrated LEDs with narrow-band emission spectra from the UV to the near-infrared range (approx. 400–850 nm) for targeted spectral excitation of photosynthetic pigments and biomass markers.
- A 16-channel hyperspectral detector that captures the spectral response of the culture with high spectral resolution and allows both absorption and fluorescence signatures to be evaluated separately.
- A 4-channel RGB+IR sensor that records the absorption, scattered light, and turbidity properties of the culture at defined wavelengths in a particularly high dynamic range, thus allowing conclusions to be drawn about cell density, aggregation states, and morphological changes.
The ratiometric evaluation of the measurement channels allows changes in chlorophyll-a and carotenoid levels, as well as shifts in photosynthetic activity, to be determined.
The main advantages of the sensor system are:
- In-situ measurement without sampling
- No optical windows → no algae growth on relevant measuring surfaces
- · Direct coupling with a digital twin of the reactor
- AI-based condition detection and process control
- High temporal resolution for the analysis of circadian dynamics
- Modular networking in the photobioreactor (LoRaWAN/WiFi)
The Mosaic sensor chip thus forms a measurement and data technology basis for scalable, automated, and explainable process control in photobioreactors — both in research and industrial algae production.

Research Highlights 2025
Optical Monitoring of Biomass Growth

The figure shows the temporal course of optically measured biomass. Alongside the raw data, a smoothed function derived from the measurements is displayed, which closely follows the data points.
During the ten-day observation period, the biomass increases about fivefold, though temporary declines are also apparent. Whether these represent true biological fluctuations or measurement errors remains to be clarified through further investigation. In addition, oscillations can be discerned in the signal, which become more evident when examining the derivative of the curve.
Optical Analysis of Biomass Growth Rate

The derivative of the curve represents the temporal change in biomass and thus the current growth rate. Oscillations are again visible, though they diminish toward the end of the observation period. These fluctuations appear to follow an approximate daily rhythm.
Overall, the growth rate remains predominantly positive, consistent with the general increase in biomass already shown in the previous figure.
Circadian Rhythm in Biomass Growth

To examine the daily rhythm of the oscillations in more detail, this figure shows a magnified section of the previous graph. The time stamps confirm an approximately 24-hour cycle, consistent with a circadian rhythm. The data also indicate that algae grow primarily during the night, while the minimum of their growth phase occurs around midday.
Time resolved fluorescence tomography
Investigators: Franz-Josef Schmitt, Fabian
Rieder
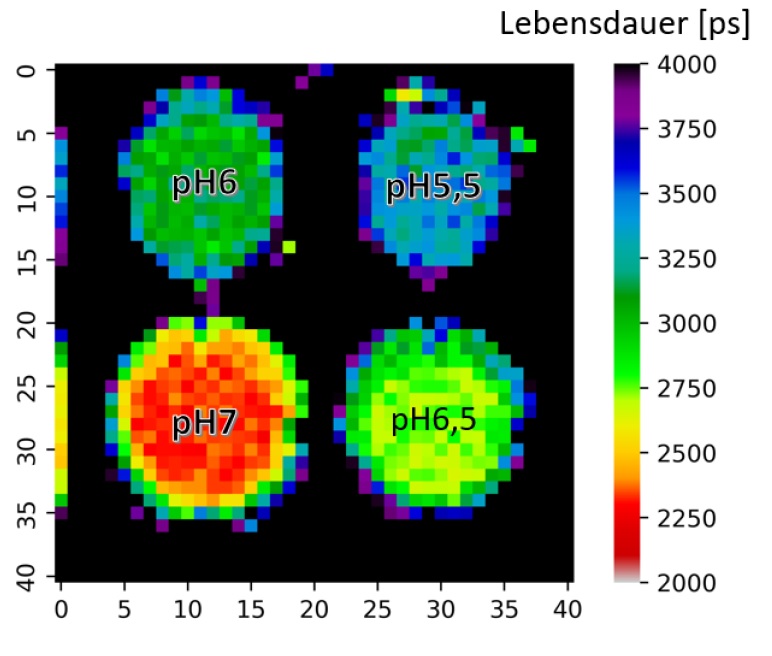
The Figure shows a lifetime plot of the pH values in a microwell plate determined with time resolved fluorescence tomography and pH sensitive marker molecules (fluorescein-isothiocyanate, FITC)
The group investigates time-resolved fluorescence tomography (FT) for three-dimensional visualization of fluorescent tissues with quantitative depth sensitivity. One goal is the determination of the local pH value by combining time resolved fluorescence with pH sensitive marker molecules.
In FT, tissue is excitedtypically in the near-infrared windowand the resulting emission is recorded at multiple surface positions and viewing angles. Specific fluorescence markers with pH dependent fluorescence lifetime can be used to generate a 3D pH map of the tissue based on the local fluorescence lifetime (See Fig.).
The fluorescence lifetime is widely independent of the chromophore concentration and only marginally distorted by autofluorescent signals so that it represents a much better ruler for the pH as intensity based measurements.
Performance is assessed using tissue-mimicking phantoms and ex vivo samples to quantify spatial resolution, sensitivity, contrast-to-noise ratio, and absolute concentration accuracy.
Fluorescent molecules in cancer diagnostics
Investigator: Franz-Josef Schmitt
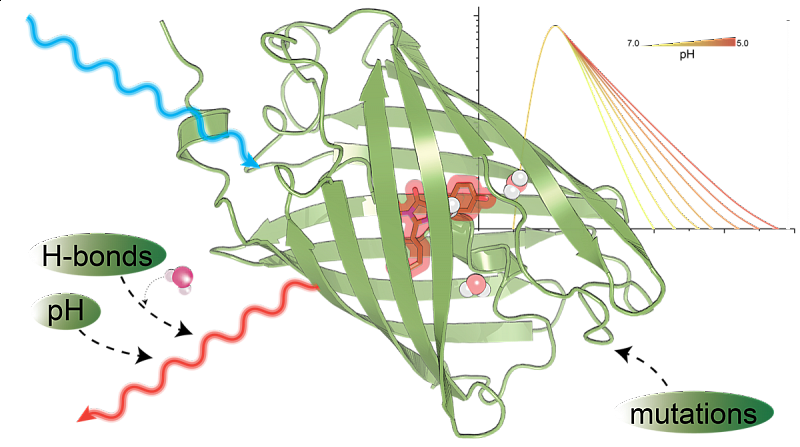
The figure shows that targeted mutations enhance fluorescent proteins by optimizing chromophore stabilisation, chromophore-water-interaction and excited-state proton transfer for bright sensors with strong pH sensitivity.
We dissect the pH dependence of far-red fluorescent proteins by coupling broadband absorption/emission spectroscopy with multichannel time-correlated single-photon counting (TCSPC) and decay-associated spectra (DAS) analysis. Kinetic models fitted to the DAS reveal the pH dependency of intramolecular relaxation channels and help to understand the interaction of the molecules with protons and support the specific design of optimized pH sensors.
Molecular dynamics (MD) at different protonation states rationalize the observed photophysics and give rise to understanding the role of specific amino acids in stabilisation of the chromophore and modulation of the excited-state proton transfer (ESPT) efficiency, providing a mechanistic basis for pH-sensitive lifetime and insensity measurements.
Collectively, the combined spectroscopymodellingMD framework links intramolecular water/chromophore dynamics to ESPT-controlled rates and establishes design rules for red fluorescent protein pH biosensors compatible with lifetime-based readouts, super-resolution/ultrafast fluorescence microscopy, and pumpprobe photoacoustic reporting in vivo (See Fig.).